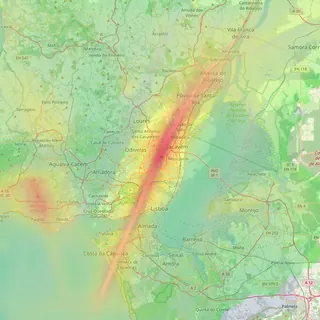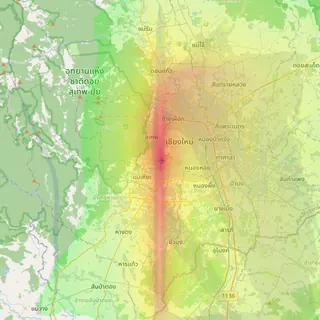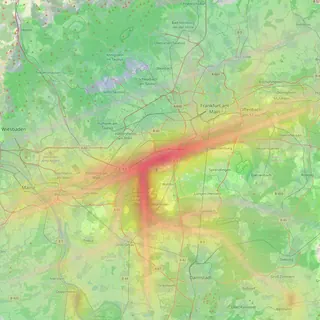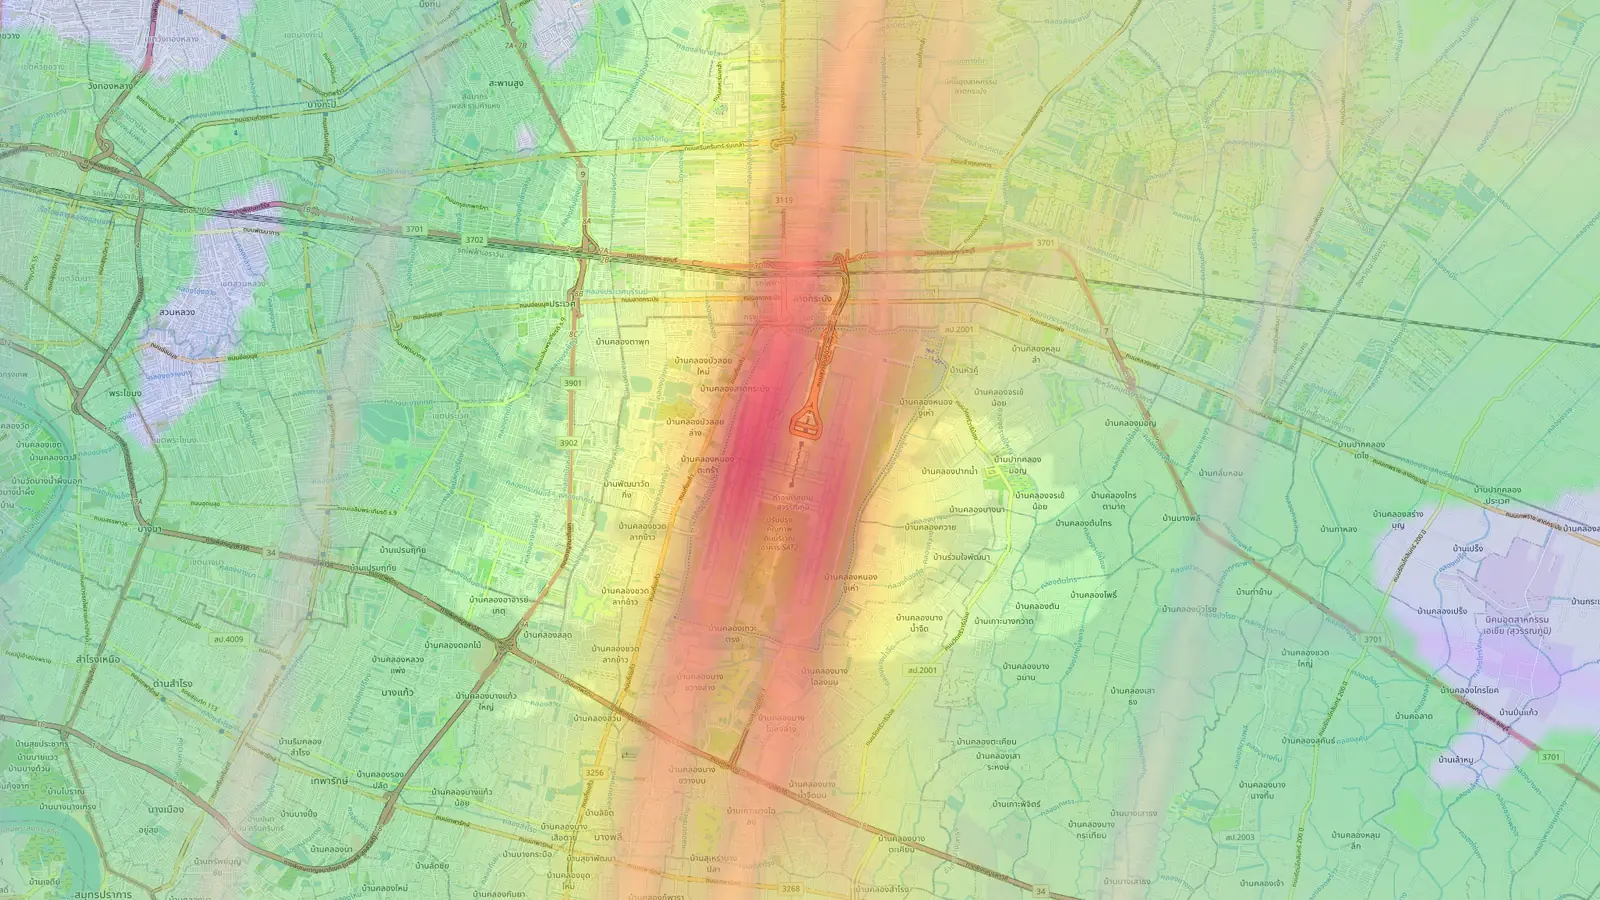
Every airport page now has a noise guide
Below the map, each of our nine airport pages now has a stats dashboard, a 24-hour flight chart and a written guide to the neighbourhoods around it.
On this page
An airport map answers “where do the planes go?” well. It is harder to read off it which neighbourhoods are worst affected, what time of day traffic peaks, or whether an area that looks quiet on the map stays quiet all week. From today every airport page answers those questions in writing, directly below the map.
The change covers all nine airports: Chiang Mai, Bangkok Suvarnabhumi, Da Nang, Taipei Songshan, Bali, Tallinn, Lisbon, Valencia and Sofia.
A dashboard of the airport’s traffic
Scroll down from the map and the first thing you reach is a set of stat cards built from the flights we have recorded around the airport over roughly the last month:
- average flights per day
- the busiest hour of the day, in the airport’s local time
- the quietest hour, with the typical number of flights in it
- the loudest hour, when the noisiest aircraft tend to pass
- a “Loudest area” card naming the neighbourhood our guide picks out as most exposed, with a small street map so you can place it
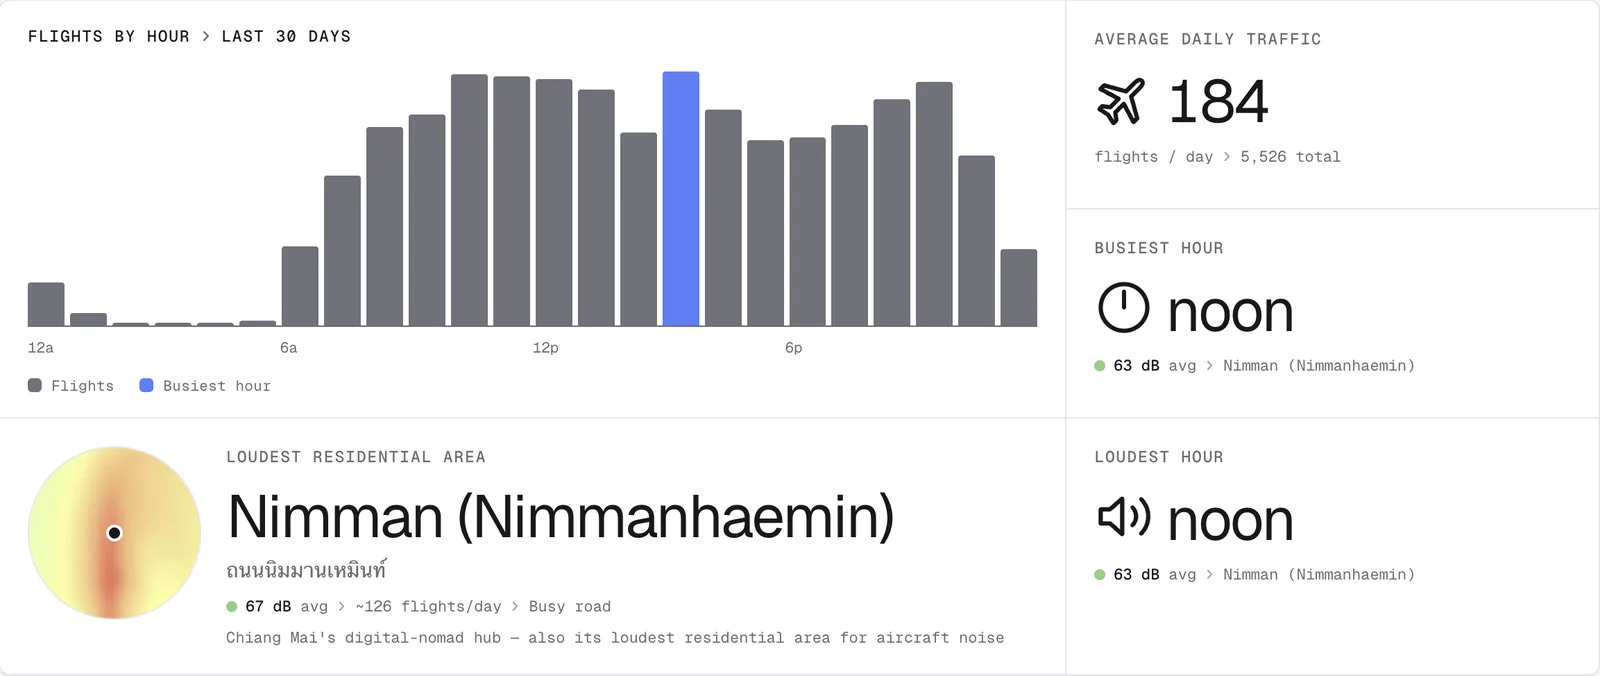
Next to the cards is a 24-hour chart with one bar per hour. Hover over a bar to see the figure for that hour, and use the toggle above it to switch between flight counts and noise. The bars are coloured with the same scale as the heatmap, so a red bar means the same thing as a red patch on the map.
On a wide screen, a compact version of the key stats stays pinned to the left of the page as you read, along with the airport’s current local time and links to jump between sections. On a phone the same content stacks into a single column.
A written guide to the neighbourhoods
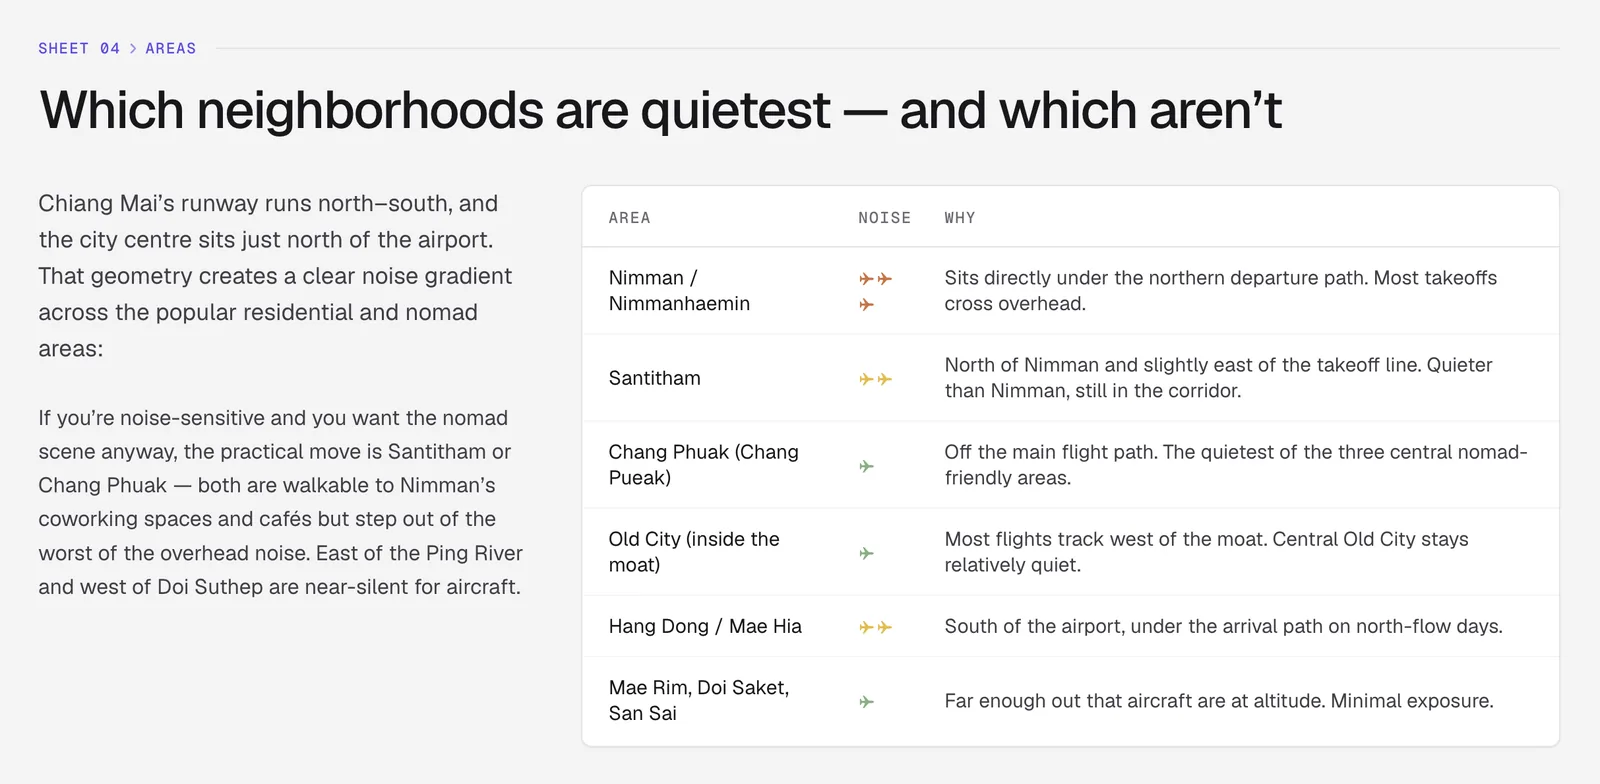
Under the dashboard is a guide to living near the airport. Each one names the neighbourhoods close to the approach and departure paths, says roughly how exposed each one is, and gives local place names in the local script where that helps, so you can match them to an address or a property listing.
The guides also explain the flight patterns: which way the runway points, which direction aircraft usually take off and land, and how that changes the areas that hear them. They say when the airport is busiest and when it is quietest. In Chiang Mai, for example, the guide explains why Nimman, which sits under the northern departure path, hears far more aircraft than nearby Chang Phuak or the Old City.
Each guide ends with frequently asked questions from people renting, buying or staying near the airport, and a list of the sources it draws on, such as local news reports and published noise studies.
How to use the guide with the map
The guide and the map work best together. Read the guide to narrow down which parts of the city are under the flight paths, then go back up to the map and click the streets you are considering. The point report gives you the estimated daily average level, the loudest overflight, flights per day and an hourly breakdown for that exact spot.
The noise figures on these pages are estimates calculated from recorded flight tracks rather than microphone readings. They are most useful for comparing one area with another, and for spotting the hours when aircraft are most likely to bother you.
Frequently asked questions
- How current are the dashboard numbers?
- They are worked out from the flights we have recorded around each airport over roughly the last 30 days, so they move as traffic changes. Airports added recently have less history and their numbers will settle over the first few weeks.
- Do the guides replace checking my own address?
- No. The guides describe the area in general terms. For a specific street, click it on the map or search for it, and read the noise report for that exact point.
Airports mentioned
Related updates
Search an address, save pins, share them and compare places
Type an address to check its noise, keep it as a saved pin, send your pins to someone by link, and compare saved places side by side.
Flight Path Noise launches with nine airports
Free aircraft noise maps for nine airports in eight countries, starting with Chiang Mai, with live aircraft, noise heatmaps and a new globe homepage.
Does your airport have a curfew? Every airport page now answers
Every airport page on Flight Path Noise now opens with a plain yes, partial or no answer on night curfews, with the hours and a short explanation.