A calibrated noise model, checked against real noise monitors
Our noise levels are now calibrated against official airport noise-monitoring data, and flight tracks are smoothed so turns are drawn properly.
On this page
Today we’re releasing the biggest change to our noise estimates since Flight Path Noise began. The model behind every pin report, heatmap and airport statistic is now calibrated against official airport noise monitors, and flight paths are drawn more smoothly. Most pin reports and airport figures will move, and this post explains which way and why.
Checked against real noise monitors
Many large airports run networks of permanent noise monitors that record the sound of aircraft passing overhead. We compared our modelled levels with official data from these networks and adjusted the model to match the measurements.
A model can always be tuned to fit one place, so we also tested it at airports it hadn’t been tuned on. It held up there too. Monthly average levels now sit within a few decibels of what the monitors record.
Our levels are still modelled estimates rather than measurements. A single overflight can be louder or quieter than predicted because of wind, temperature, terrain and how the aircraft is flown. What has changed is that the model is now anchored to real-world measurements.
What changes on pin reports and airport pages
At most airports, the levels you see will go down, because the earlier estimates tended to read on the loud side. Peak levels mostly fall too, though at some spots they rise, because the smoother flight paths now catch close passes more accurately.
“Daily Avg” keeps its meaning: the average level from aircraft over the last 30 days, while they can be heard. Flights per day in a pin report count only flights loud enough to be heard at that spot, so that count can drop at some addresses now that levels are lower. The methodology page explains how the figures are worked out.
The loudest-area figures and hourly levels on each airport page move with the pins as each airport’s statistics refresh.
Higher levels at high-altitude airports
One change goes the other way. The model now measures an aircraft’s height from the ground at the airport rather than from sea level. That makes little difference at airports near the coast, but at Denver, more than 1,600 m above sea level, aircraft are much closer to the ground than a sea-level reading suggests.
Levels now rise at high-altitude airports, including Denver, Bogotá, Mexico City, Cusco, Kathmandu, Salt Lake City, Medellín, Bangalore and São Paulo.
Smoother tracks on the map
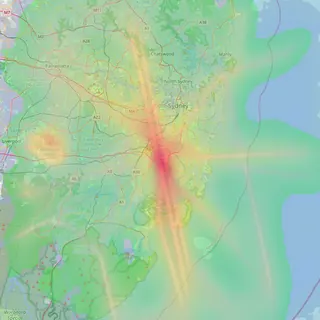
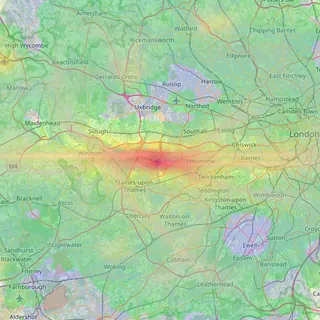
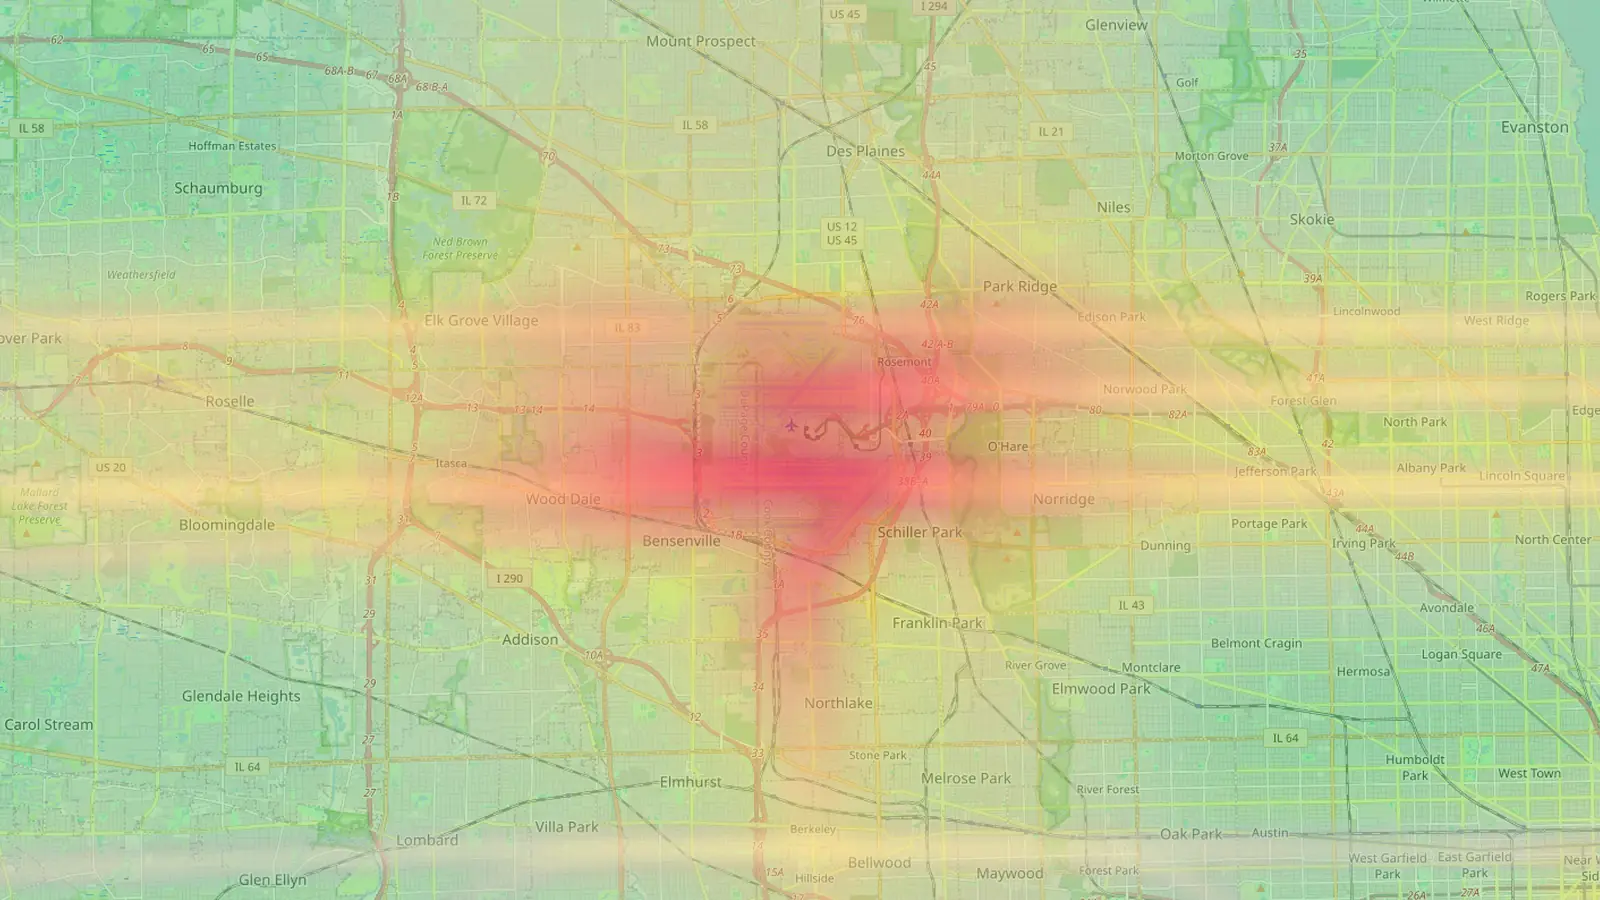
Flight paths now follow the turns aircraft actually make. On the route density map and in live trails, turns draw as smooth curves instead of straight segments, and stray straight lines across the map are gone. The heatmap uses the same smoother paths, which sharpens the picture close to the flight paths.
The heatmap’s colours are relative to each airport, so it will look much the same, with its shape refined. To see what the new model says about a particular street, open its airport map and drop a pin.
Frequently asked questions
- Why did the numbers for my address go down?
- Checked against official noise-monitoring data, the earlier estimates read on the loud side. The calibrated model sits within a few decibels of measured monthly levels, so most pins now show lower figures.
- Why did the numbers go up at my airport?
- If your airport sits high above sea level, the model now measures an aircraft's height from the ground at the airport rather than from sea level. Aircraft there are closer to the ground than they were being treated, so levels rise.
Airports mentioned
Related updates
61 airports: Sydney, Melbourne and 49 more cities
Flight Path Noise now covers 61 airports in 34 countries, including our first Australian airports and 50 cities where the airport sits close to home.
Flight Path Noise passes 100 airports
42 new airports across the US, Europe, Asia, Latin America, the Middle East, Africa, Australia and New Zealand take us to 103 airports in 49 countries.
Heathrow, LAX, JFK, O'Hare, CDG and 11 more major hubs
16 of the world's major hub airports join Flight Path Noise, and the main airport now takes the city's address for London, Toronto and Paris.