Hourly noise at each airport's loudest neighbourhood
Airport pages now show the hourly noise level at each airport's loudest residential area, for the busiest hour and the loudest hour of the day.
On this page
Today we’re changing what the peak-hour figures on airport pages mean. The “Peak hour” entry in the key facts row, and the busiest-hour and loudest-hour cards in the statistics section, now show a real hourly noise level at one fixed point near each airport: its loudest residential area.
What the new number is
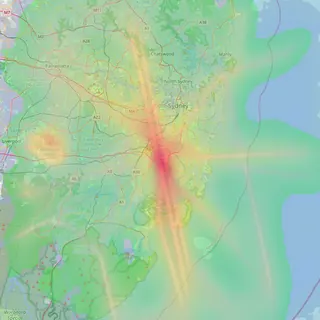
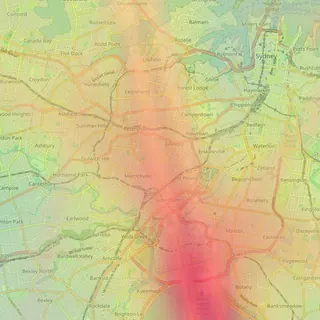
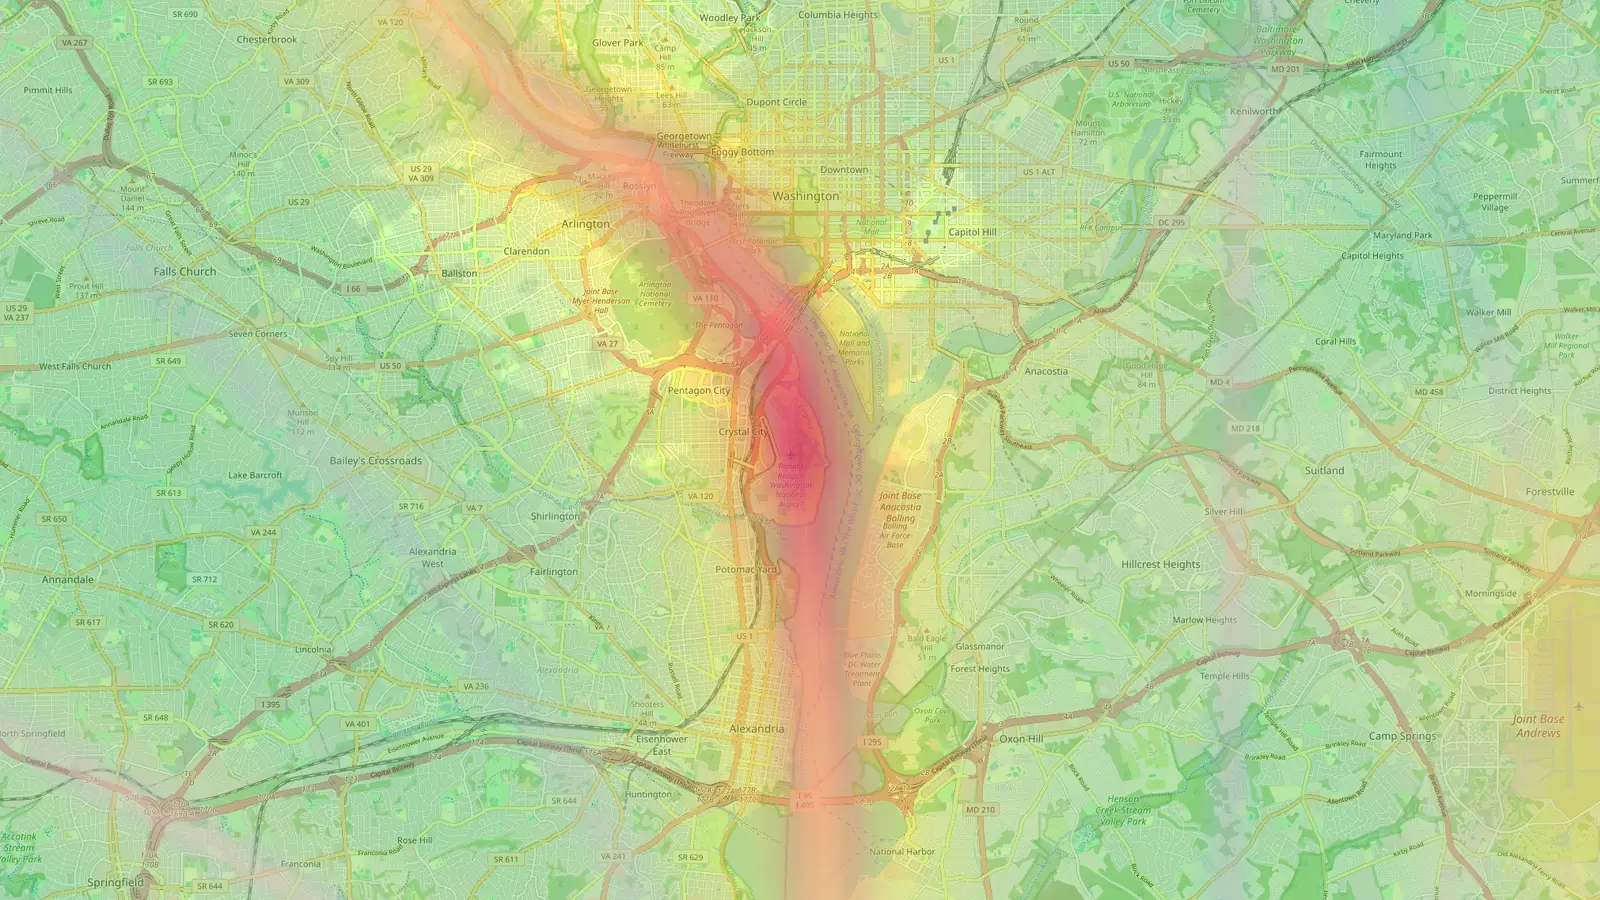
Each airport page already names its loudest area, the residential spot near the airport where our model puts the highest noise exposure. On the Sydney page that’s Sydenham. At Chicago O’Hare it’s Schiller Park, and at Washington Reagan it’s Rosslyn.
For that point we now work out the noise level for each hour of the day, as a time-weighted average. It takes the sound of every flight that passes in the hour, adds it up, and spreads it across the full 60 minutes, quiet gaps included. That’s the standard way to describe how noisy an hour is. It means one loud flight in an otherwise quiet hour can score lower than a steady stream of slightly quieter ones. Doubling the number of flights raises the level by about 3 dB.
The new figure replaces the earlier peak-hour figure, and it varies from airport to airport and from hour to hour, so it says much more about what you’d hear at home.
Where to find it on an airport page
The key facts row at the top of each airport page shows the peak hour and its level. Further down, the busiest-hour card gives the level at the busiest hour and names the area it applies to. Where we have a full set of hourly levels, a loudest-hour card shows the hour with the highest level.
The hourly chart shows flights by hour of the day. Hover over or tap a bar and the tooltip now gives that hour’s level at the loudest area as a second line.
The chart used to have a switch between flights and noise. We’ve removed it. When we compared the two views across several airports, the noise view mostly followed the flight counts on a compressed scale, so it added a second chart without adding much information. The level you need is now in the tooltip.
Busiest hour versus loudest hour
At most busy airports the loudest hour is the busiest hour, or very close to it, because the hourly level depends so much on how many flights there are. When two hours are nearly tied, we show the busiest one, since a gap that small is within the uncertainty of the estimate.
The exceptions are interesting. In our testing Sydney stood out: at Sydenham, late-morning hours with more heavy jets came out louder than the busiest hour of the day. Small general-aviation airports can also swing a lot from hour to hour on just a few flights.
A few things to keep in mind
The hourly level is a modelled estimate, worked out from recorded flight tracks, aircraft types and distances. It isn’t a microphone reading. It describes one point, the loudest residential area, so most homes near the airport will hear less. For your own street, drop a pin on the airport’s map and look at the hourly breakdown in the pin report.
The new figures appear airport by airport over the next few hours as each one’s statistics are refreshed. Until an airport is updated, its cards show a dash in place of the level.
Frequently asked questions
- Is the hourly level measured with a microphone?
- No. It is a modelled estimate built from recorded flight tracks, aircraft types and distances, for one point in the loudest residential area near the airport. Use it to compare hours and airports, and drop a pin on the map for your own address.
- Why are the busiest hour and the loudest hour often the same?
- The hourly level adds up the sound of every flight in the hour, so more flights usually means a higher level. When two hours are nearly tied, we treat the busiest one as the loudest, because a difference that small is within the uncertainty of the estimate.
Airports mentioned
Related updates
61 airports: Sydney, Melbourne and 49 more cities
Flight Path Noise now covers 61 airports in 34 countries, including our first Australian airports and 50 cities where the airport sits close to home.
Gatwick area pages, nearby airports on the map, and postcodes
Our first UK area pages cover 29 places around Gatwick, airport maps now show nearby airports, and suburb tables can be filtered by postcode.
Suburb noise pages for Sydney and Melbourne
267 new pages, one per suburb, show how many aircraft pass over Sydney and Melbourne suburbs, how low they fly and which airport they come from.