A new look for Flight Path Noise
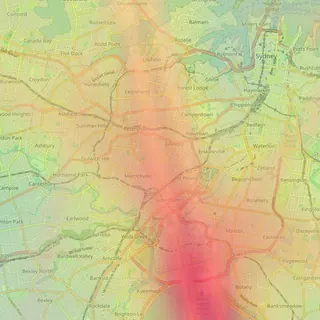
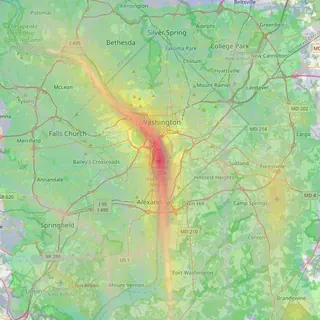
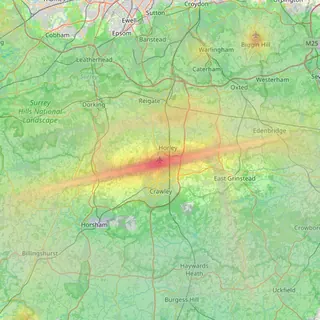
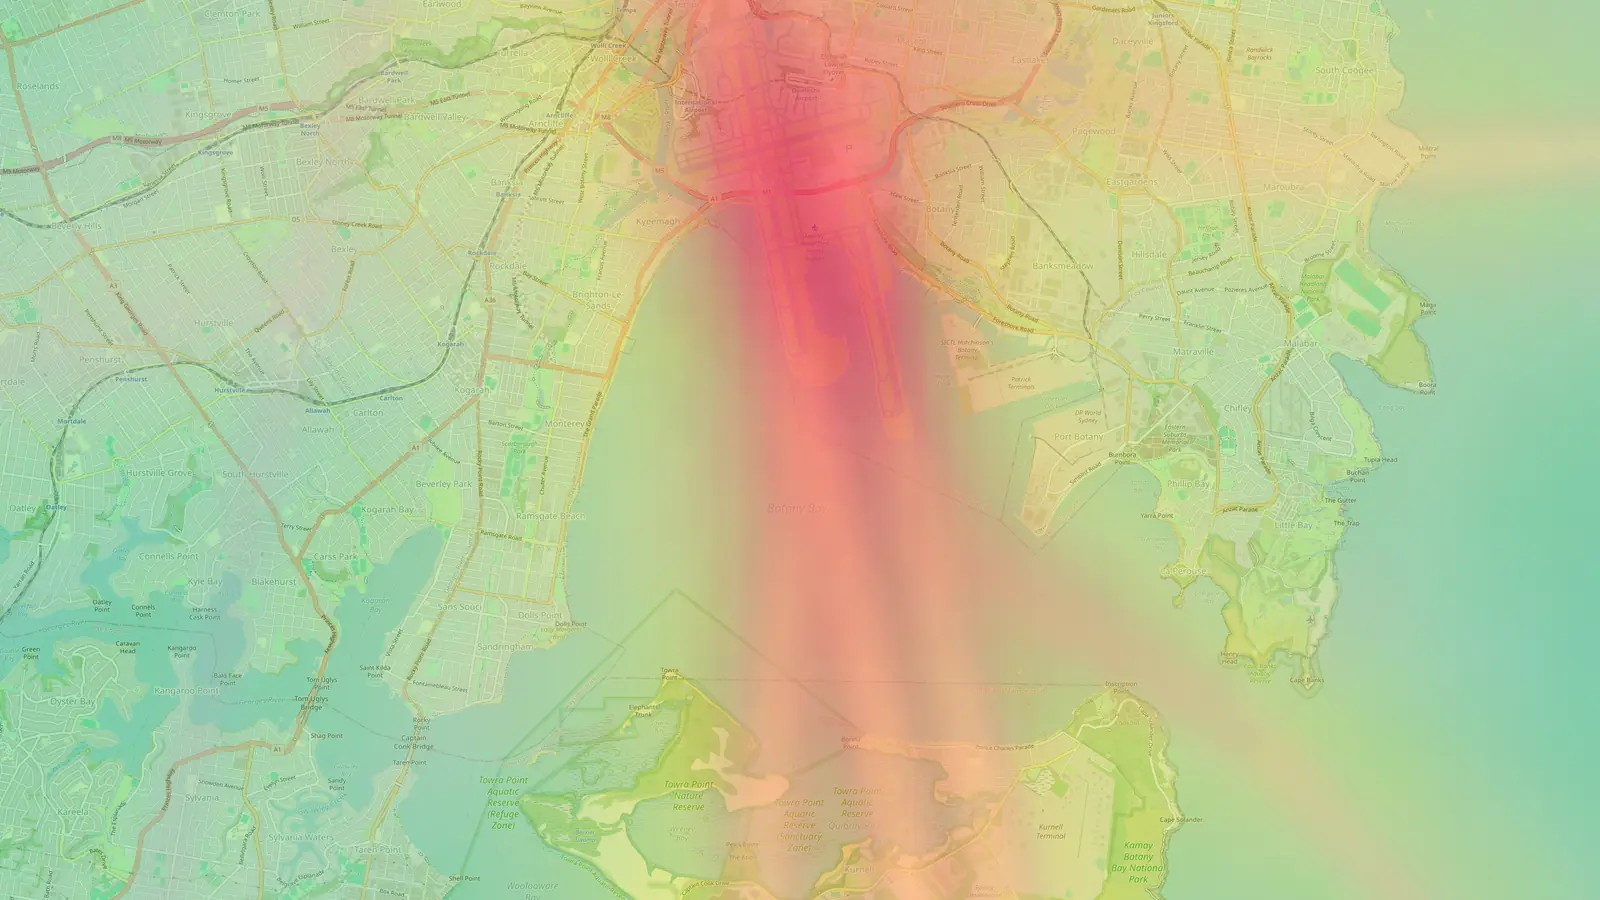
A redesigned homepage, airport pages and suburb pages, with runway drawings for all 173 airports, downloadable runway maps and search that finds suburbs.
On this page
Flight Path Noise looks different today. We’ve redesigned the homepage, every airport page and every suburb page, with new typography, a new colour system and new drawings. The information on each page and the addresses of pages are the same as before, so your bookmarks still work.
A homepage that starts with the whole network
The homepage still opens with the globe, and on larger screens it now shows day and night as they fall across the world in real time. Click any airport on it to open that airport’s map.

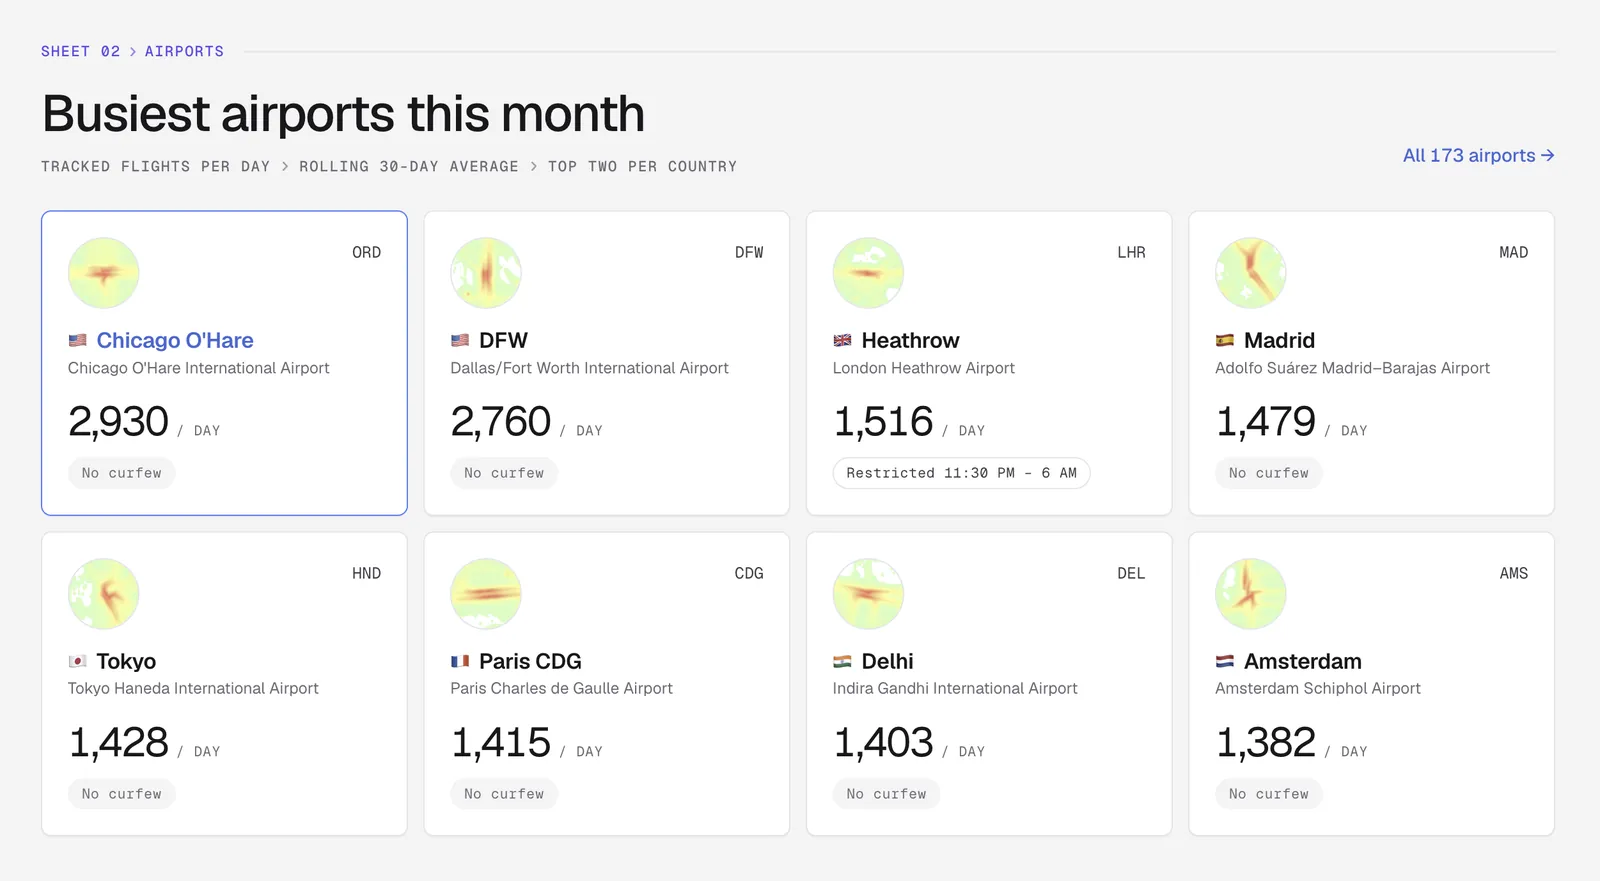
Below the globe, “Busiest airports this month” lists the airports with the most tracked flights a day over the last 30 days, two per country at most, with each one’s curfew status at a glance. A new section introduces the suburb guides, all 356 of them across Sydney, Melbourne, Brisbane, San Diego and Gatwick, with the top-ranked suburbs listed and a link to browse each city. The full list of 173 airports, with its region tabs, is still further down.
Airport pages with key facts up front
Each airport page now starts with a header row of key facts, including the airport’s codes, the local time, the coverage radius, average flights a day and the curfew hours where there are any. The contents bar under it jumps to each section, from the map and statistics to the curfew answer, neighbourhoods and FAQ.
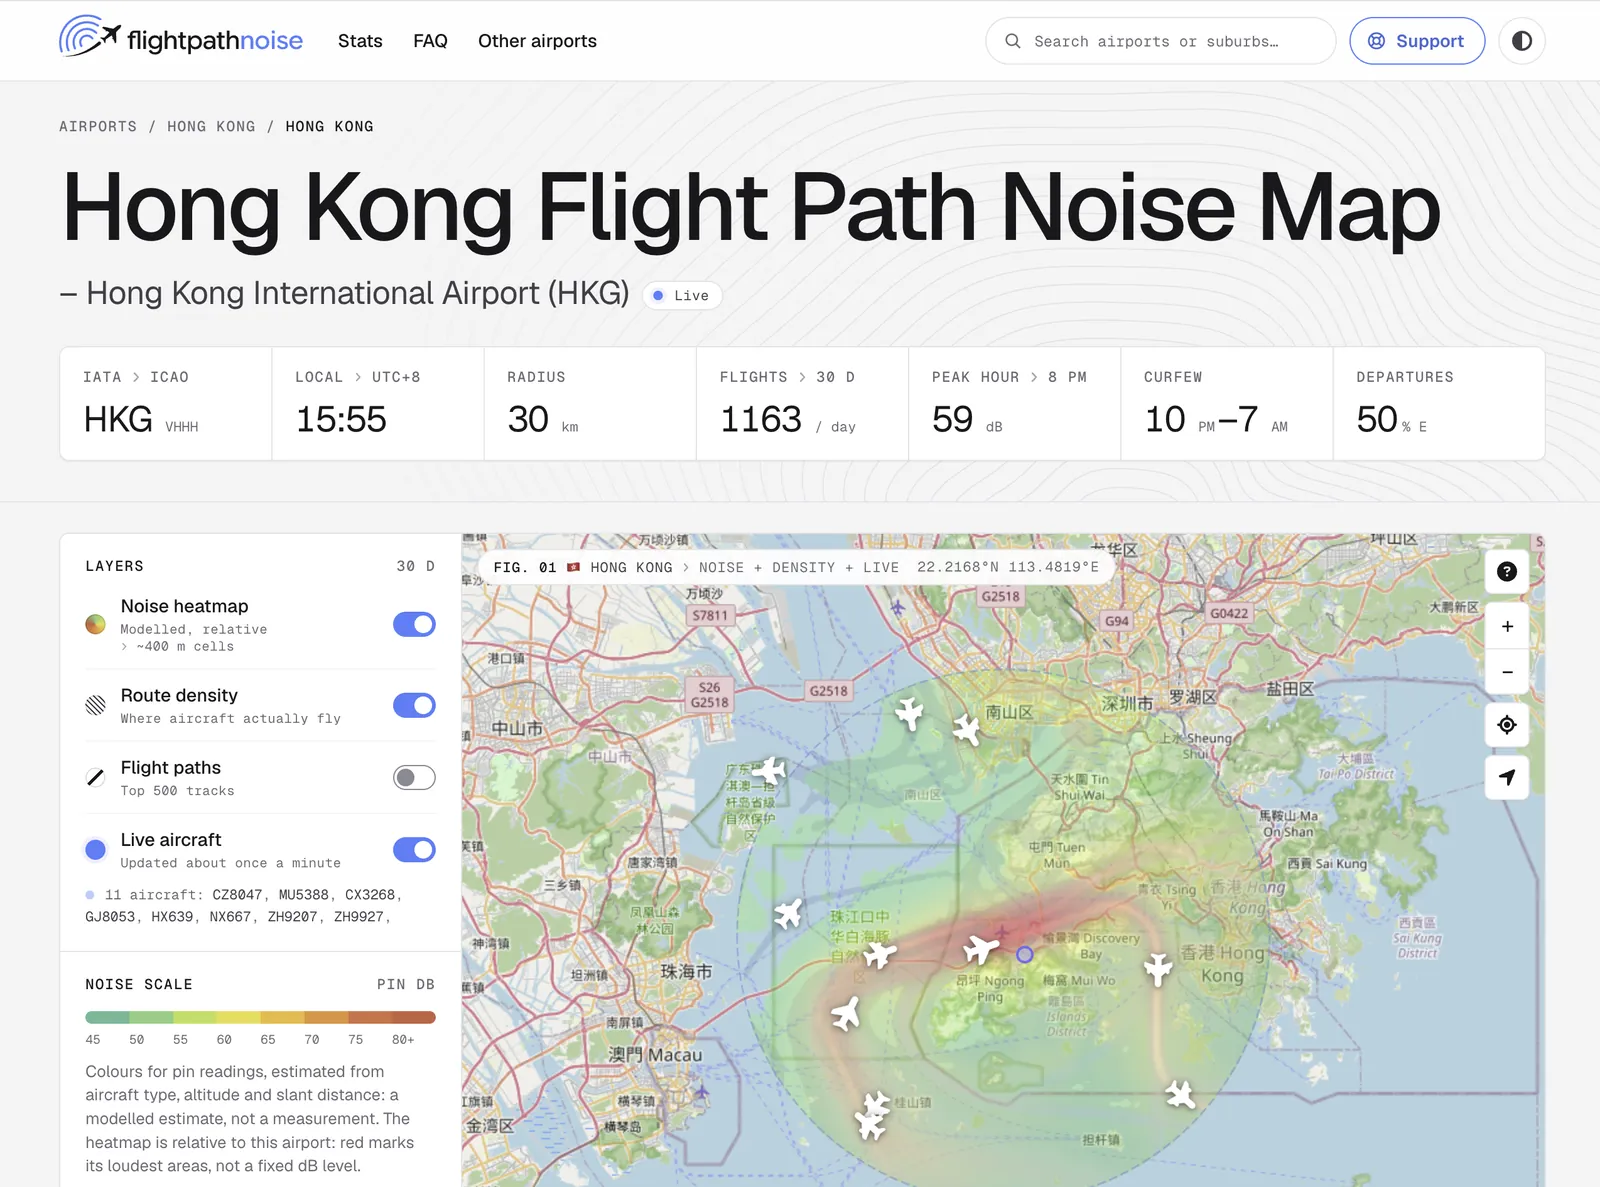
The map itself works as before. Layers, filters, address search, pins and pin comparison are all in the same places, grouped in a panel beside the map.
Runway drawings and downloadable runway maps
Every one of the 173 airports now has a plan-view drawing of its runways, drawn from OpenStreetMap data. You’ll find it in the “Flight patterns and runway use” section of each airport page, next to the written explanation of which runways are used and when. Seeing the runway layout makes the flight paths on the map much easier to follow, especially at airports with crossing or parallel runways.

You can also download each runway drawing as a high-resolution map. Look for “Download map” at the top of the runway drawing and choose light or dark. Each one is a 2400 by 2400 pixel WebP image, large enough to print or zoom into. The maps carry a credit for Flight Path Noise and for the OpenStreetMap contributors whose data they are drawn from.
Street-plan drawings and suburb search
Each airport page also has a street-plan drawing of a real neighbourhood near the airport, behind the section on checking noise at a specific address. On the Sydney page it’s the streets of Dulwich Hill in the inner west. Suburb pages such as Marrickville share the same design.

Search in the menu bar now finds suburbs as well as airports. Type “Marrickville”, “Horsham” or “Golden Hill” and the suburb page appears in its own group under the matching airports.
Correct local hours all year
Hourly figures on airport pages and in pin reports are now worked out in each airport’s own time zone, including daylight-saving changes. Before this, each airport used a fixed offset from UTC, so during daylight saving some hourly figures could be an hour out, and airports in half-hour time zones were approximated. Both now line up with the local clock.
Privacy policy and terms
We’ve also published a privacy policy and terms of use, linked from the footer of every page. The methodology page has a new section on citing our data, for anyone taking the numbers to a council, a community forum or a planning meeting.
Frequently asked questions
- Can I use the runway maps?
- Yes. Our terms of use let you reproduce our maps and images, for example in a report, an article or a presentation, as long as you credit Flight Path Noise (flightpathnoise.com) and keep the credit to OpenStreetMap contributors, whose data the runway drawings are based on.
- Did any noise figures change with the redesign?
- Only the hourly figures, which now follow local time through daylight-saving changes. Otherwise the redesign changes how pages look and how you move around the site, and the data, the noise model and the page content are the same as before.
Airports and places mentioned
Related updates
Suburb noise pages for Sydney and Melbourne
267 new pages, one per suburb, show how many aircraft pass over Sydney and Melbourne suburbs, how low they fly and which airport they come from.
Hourly noise at each airport's loudest neighbourhood
Airport pages now show the hourly noise level at each airport's loudest residential area, for the busiest hour and the loudest hour of the day.
Gatwick area pages, nearby airports on the map, and postcodes
Our first UK area pages cover 29 places around Gatwick, airport maps now show nearby airports, and suburb tables can be filtered by postcode.