Brisbane's July flight path changes: what our tracks show, suburb by suburb
We compared Brisbane arrivals before and after the 9 July 2026 flight path changes. Fewer now cross Acacia Ridge and Inala; more cross Goodna.
On this page
On 9 July 2026 Airservices Australia changed the paths aircraft fly over land when they land at Brisbane from the south. It was one of the outcomes of the Noise Action Plan for Brisbane, known as Package 3, and Airservices says it reduces the number of people overflown by about 35,000. We wanted to see what actually changed over each suburb, so we compared our own recorded tracks from before and after.
What Airservices changed
Brisbane’s two runways run north to south. When the wind is from the north, aircraft land towards the north, which means they approach over the city and touch down at the southern ends of the runways. Those are the paths that changed in July: the route in from the coast and the turn onto final approach for aircraft heading to the old eastern runway, and the turn onto final approach for aircraft heading to the new western runway from the north and west.
Departures did not change in July, and neither did arrivals over Moreton Bay. Airservices says more changes are on the way, including moving arrivals over the water further north and moving south-east departures further east.
How we compared before and after
We took every arrival in our records for the three and a half weeks before the change (15 June to 8 July) and the four months after (10 July to 10 November), and kept those landing towards the north. For each suburb we counted how many of them passed over it below 10,000 feet.
Two things needed care. The first is wind. Aircraft landed from the south nearly three times as often per day in the later period, simply because of the weather, so every figure here is per 100 arrivals from the south rather than per day. The second is how often we record a position. That changed between the two periods, so we put both through the same processing before comparing them. Doing it the other way round moved the results by less than one flight in 100.
Where the arrivals moved
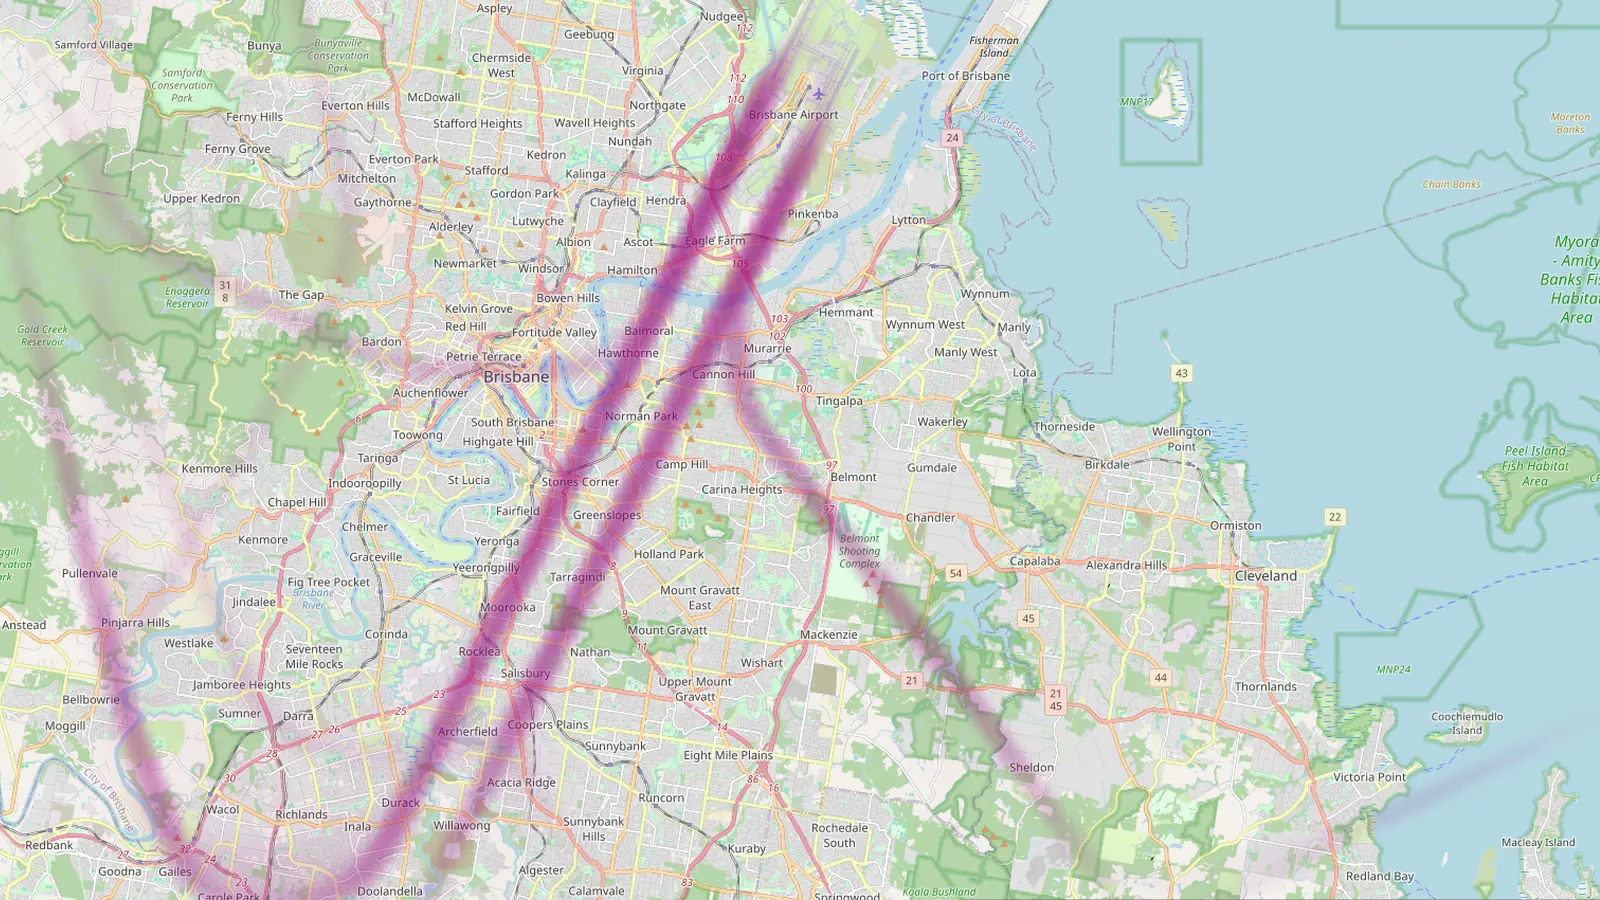
The maps below show arrivals landing towards the north, below 10,000 feet. The darker the line, the larger the share of arrivals that flew there. Grey areas are outside our coverage. Drag the handle to compare.
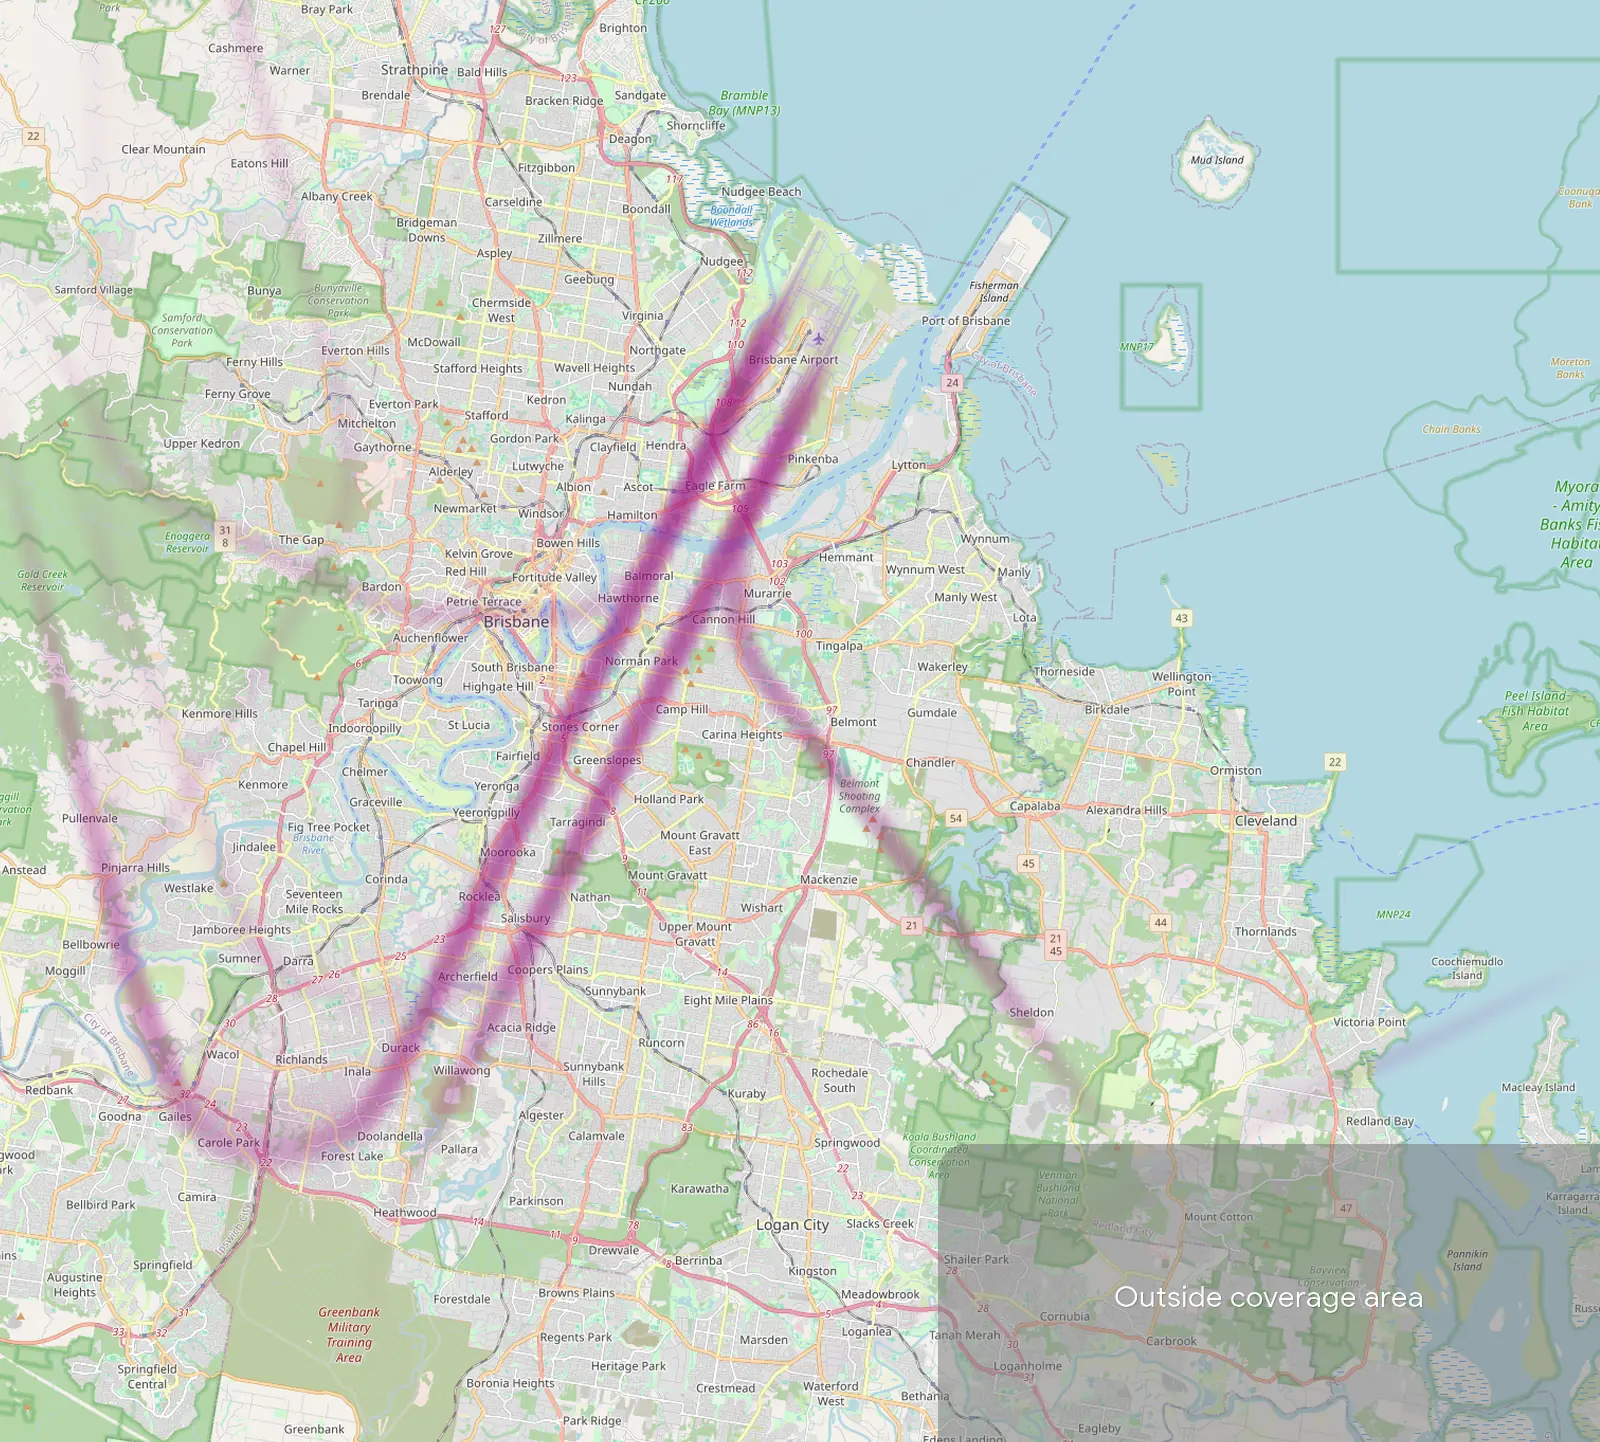
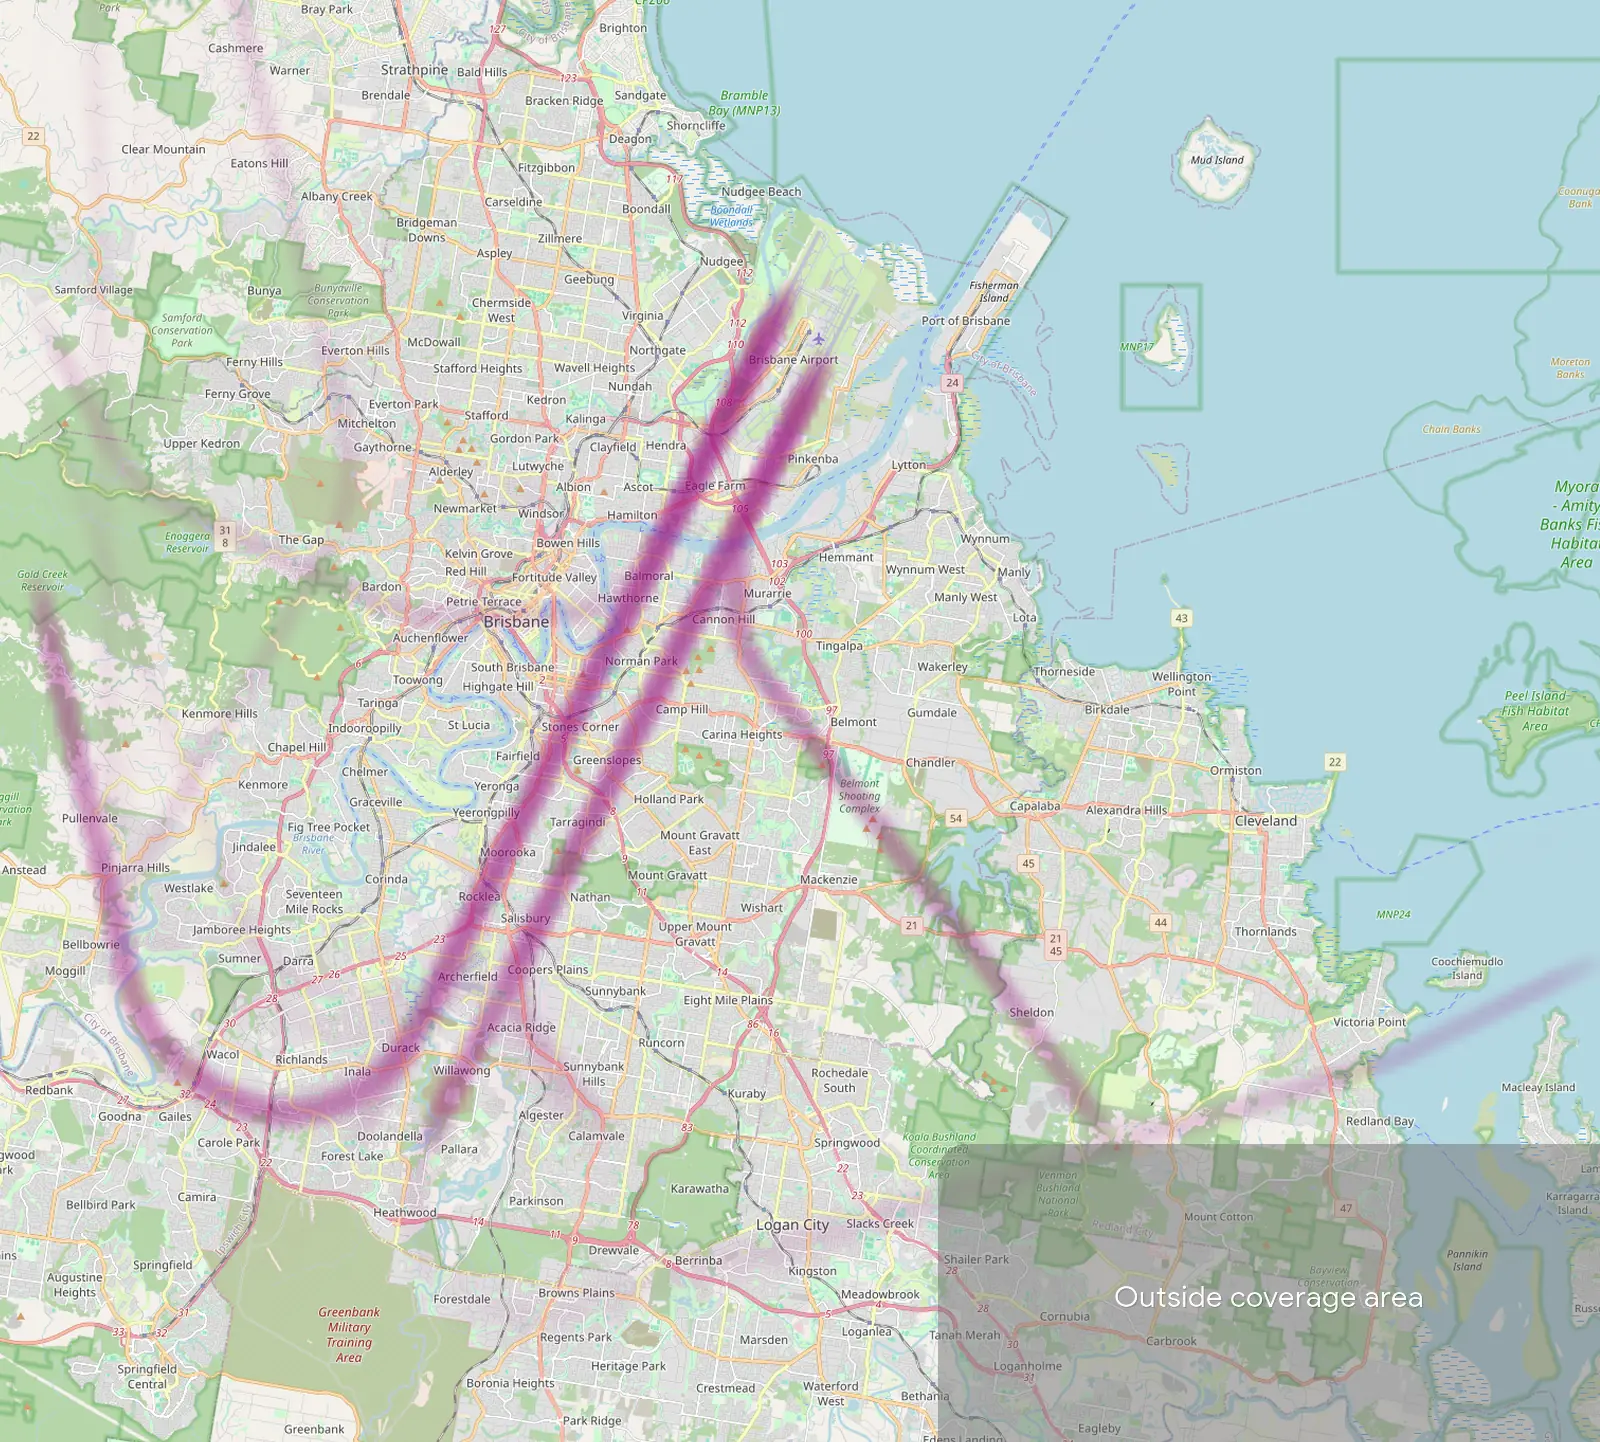
The clearest change is to aircraft arriving from the west. Before July, most swung round in a wide arc over Wacol, Inala and Durack and joined the final approach near Archerfield and Acacia Ridge. Now they turn further out, over Goodna, Gailes and Carole Park, and join the final approach further from the airport. The tables show how many of every 100 arrivals from the south passed over each suburb.
| Suburb | Before, per 100 arrivals | After, per 100 arrivals | Net change |
|---|---|---|---|
| Acacia Ridge | 60 | 51 | −9 |
| Willawong | 69 | 59 | −10 |
| Archerfield | 74 | 69 | −5 |
| Pallara | 15 | 7 | −8 |
| Algester | 9 | 3 | −6 |
| Forest Lake | 37 | 31 | −6 |
| Inala | 43 | 38 | −5 |
| Doolandella | 21 | 33 | +12 |
| Riverhills | 13 | 22 | +9 |
| Goodna | 1 | 23 | +22 |
| Gailes | 1 | 25 | +24 |
Closer in: no real change on the final approach
Closer to the airport, where aircraft are already lined up with the runways, almost nothing changed. The differences in this table are one or two in every 100 arrivals, which is less than the numbers shift just from changing which weeks you compare, so we would not read anything into them.
| Suburb | Before, per 100 arrivals | After, per 100 arrivals | Net change |
|---|---|---|---|
| Morningside | 84 | 83 | −1 |
| Norman Park | 78 | 78 | 0 |
| Coorparoo | 36 | 37 | +1 |
| Camp Hill | 36 | 37 | +1 |
| Greenslopes | 36 | 38 | +2 |
| Hamilton | 49 | 47 | −2 |
| Bulimba | 48 | 46 | −2 |
| Cannon Hill | 50 | 52 | +2 |
| Carindale | 15 | 15 | 0 |
| Carina | 15 | 15 | 0 |
| Belmont | 15 | 15 | 0 |
Heights hardly moved anywhere: the change was to where aircraft fly, not how high.
What this means if you live there
Whether you notice the change depends on the wind. On days when Brisbane lands from the south, the share of arrivals over your suburb is what moved. On days when it lands from the north over the bay, nothing changed for these suburbs.
Our coverage reaches about 25 km from the airport, so suburbs further out, such as Bribie Island or Woorim, are not included. The figures come from recorded flight tracks and are a comparison of two periods, not a forecast. Flight paths at Brisbane will keep changing as the rest of the Noise Action Plan rolls out, and we will look again when they do.
To check your own street, open the Brisbane map, search your address and drop a pin. Our Brisbane suburb pages also break down daily overflights for 30 suburbs near the airport.
Frequently asked questions
- Why are the figures per 100 arrivals rather than per day?
- Aircraft land into the wind, so how often Brisbane lands from the south depends on the weather. In our later period it happened nearly three times as often per day as in the earlier one. Counting per 100 arrivals from the south shows where the paths moved, without the weather getting mixed in.
- Does this cover departures or arrivals over the bay?
- No. The 9 July change was to arrivals over land to the southern runway ends, so that is what we measured. Airservices says further changes, including arrivals over the water to the northern end of the new runway, will follow.
- My suburb is not in the table. How do I check it?
- Open the Brisbane map, search your address and drop a pin. The report shows flights per day loud enough to hear there, the loudest overflights and an hourly breakdown, based on the last 30 days.
Airports and places mentioned
Related updates
Brisbane suburb noise pages
30 new suburb noise pages for Brisbane combine Brisbane Airport and Archerfield traffic, from Tingalpa and East Brisbane to Hamilton and Bulimba.
Flight Path Noise passes 100 airports
42 new airports across the US, Europe, Asia, Latin America, the Middle East, Africa, Australia and New Zealand take us to 103 airports in 49 countries.
Perth and Adelaide suburb noise pages
60 new suburb noise pages for Perth and Adelaide, from Queens Park and Guildford to North Adelaide and Parafield Gardens.